Data Science Project: Surgery Volume Prediction
This article is written by Alparslan Mesri and Cem ÖZÇELİK.

It is very important for a health institution that the patients who come to this institution leave the health institution satisfied. The satisfaction of the patients who come to the health institution is fed by various parameters such as the service they receive, the positive attitudes of the health institution employees, the facilities offered by the equipment of the institution to the visitors and the like. At the same time, in addition to providing these opportunities to its visitors, there are also measures that a health institution can take in various areas in order to serve more than one patient or visitor and to get the best service for the patients who are in the customer position. For example, the correct planning of the appointments given to the patients, the time to deal with a patient, the precautions and preparations to be made for the post-operative care services of the patients who need surgery will increase the satisfaction of the patients.
In our study, we focused on a problem in order to prevent the disruptions arising from planning in the post-operative processes in order to ensure the satisfaction of the patients who need to have an operation in a hospital. And in this context, we went over the question of “How many days before the operation should be given to a patient who needs an operation”. So much so that with the answer we can find to this problem, while the patients are planning their own lives, the healthcare institution management will be able to make their own planning so that the patient can get the best service in the post-operative period.
In this article, surgeries performed in a health institution have been studied on a sample data set, and how many days in advance is it appropriate to give the surgery date so that the health institution can provide the best service to these patients? An attempt was made to find an answer to the question. You can find the dataset and our related nootbook here.
In order to clarify our purpose in this problem, we can say the following: In this problem, we will try to predict the number of operations that will take place in the hospital at time t, 3 days before and 7 days before, and compare the success rates of these estimations.
Without further ado, let’s get to our work. Let’s start by importing our libraries first.
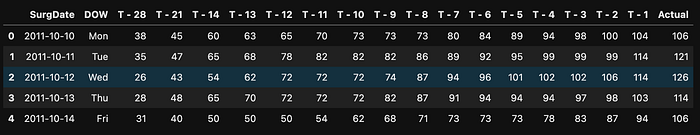
Next, let’s import our dataset.
Let’s take a look at the descriptive statistics of the data set.
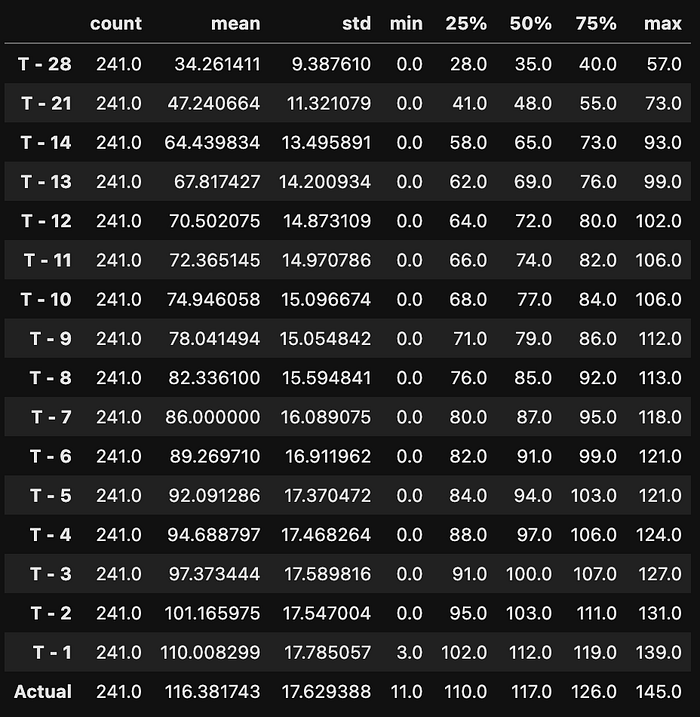
As can be seen, our dataset includes Actual(Number of operations performed on the date of the operation) and the number of operations 28 days before the time point named Actual. The values in the data set are increasing cumulatively.
Here, our next step will be to look at the auto-correlation values between the days. Since the problem we are considering can be considered as a time series problem, we will use the auto-correlation value to find the connection between the event occurring in a time unit and the event occurring in the previous time unit. To give brief information about the auto-correlation value, the auto-correlation between the day before today and today is expected to converge to 1.00, and the correlation will gradually decrease as we go back from today.
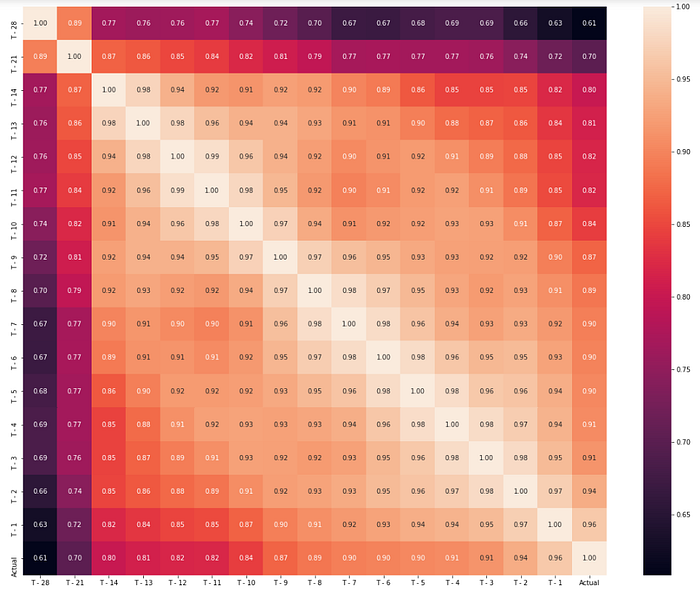
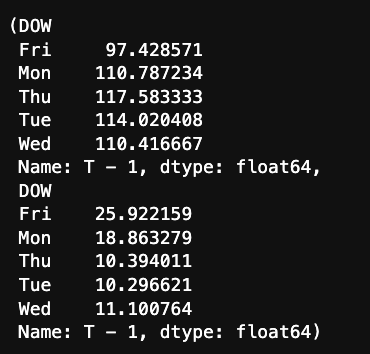
Let’s now answer the question of “Is there a connection between the days of the week and the surgeries performed in the health institution” by making an aggregation between the days of the week. Here, we have aggregated according to the time zone T-1, which has the highest autocorrelation with the Actual value.
The first 5 rows in this image show the average values and the next 5 rows show the std deviations.
Now that we have seen the statistical values of our dataset, let’s get more descriptive information about our dataset and the problem we are dealing with by doing data visualization.
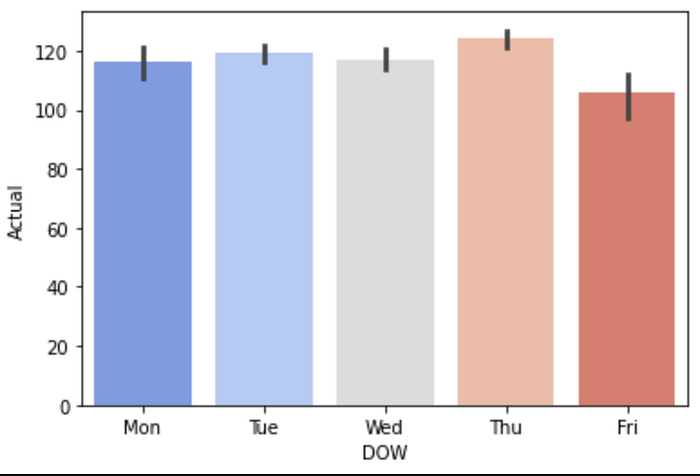
As can be seen, the most surgeries on the days of the week are on Thursday. The least number of surgeries take place on Friday. Let’s also examine the average differences in the number of surgeries performed using boxplot.
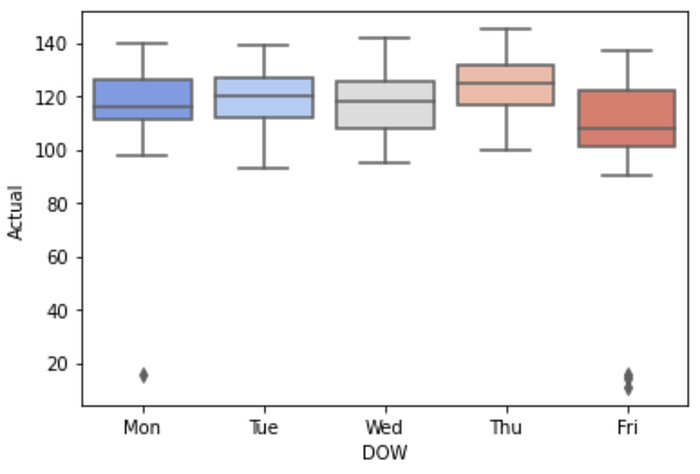
We see that by looking at the number of surgeries performed on the days of the week, we can conclude that there is a difference between the averages. Since Friday and Monday are the end and start days of the week, we can interpret that the noise level is more prominent on these two days. However, we need to prove this interpretation made with the eye statistically.
After visualizing the variables of the data set, let’s perform anomaly test for the numerical variables in the data set. We will use the One-Way ANOVA test for this.
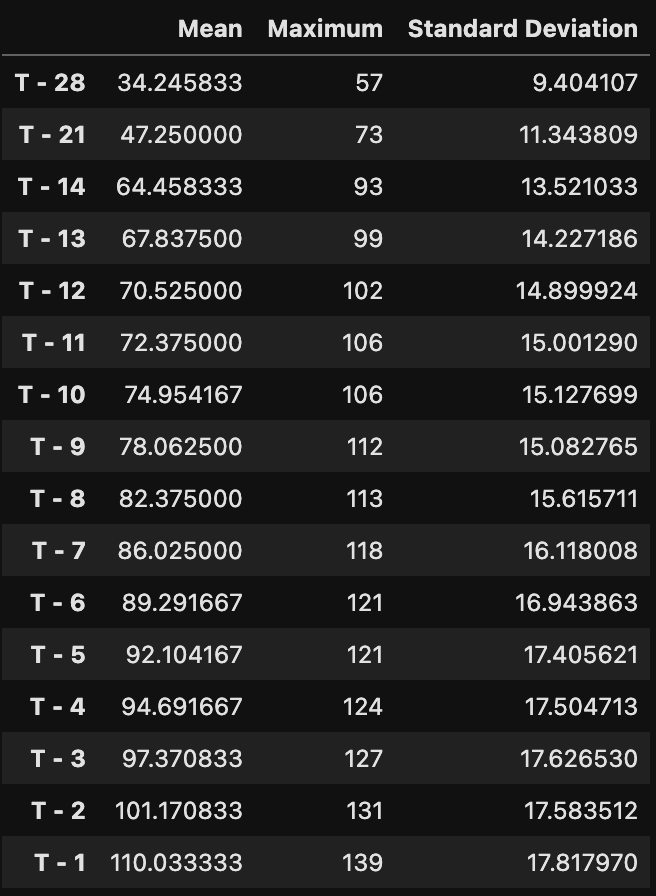
Since we examined the mean and std deviation values of the variables named T-x* in the data set in a table, we can perform our ANOVA test. Before we run our ANOVA test, let’s set up our hypotheses, which we call H0 and H1:
H0: The total number of operations does not differ according to the day of the week.
H1 (Alternative Hypothesis): The total number of operations varies according to the day of the week.
The result table of the ANOVA test we performed is as follows. At the bottom of the table, you can see the results of the ANOVA test:
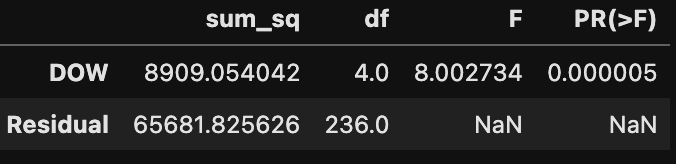
- By looking at the ANOVA test result, we reject the H0 hypothesis at the 99% confidence interval. As a result of the test, we see that the P-value we see is <0.05.
- By looking at the test result, we can clearly say: There is a statistical difference between the days of the week.
After this stage, we test with the TUKEY test whether there is a significant difference between the number of operations performed on one day of the week and another weekday in combination with it.
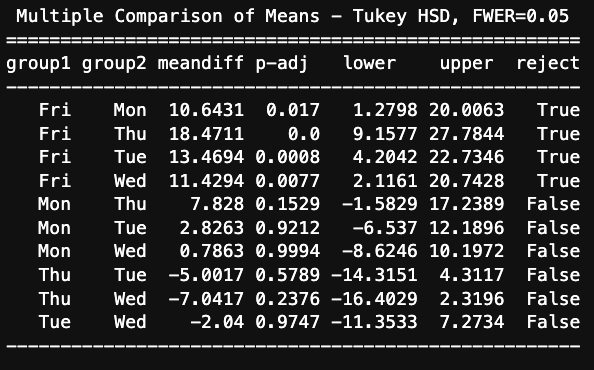
TUKEY Test results show us that there is a difference between the number of operations performed on any weekday and the number of operations performed in another week.
Now, we will be establishing a linear regression model in order to find an answer to the question “How many days before the surgery can we give the most appropriate surgery appointment to a patient who comes to the hospital for surgery?”
First, let’s clarify the parameters of our model that we will build on our dataset:
- The dependent variable to be used in the Linear Regression model is the “Actual” variable. Our independent variables are all columns T-1 through T-28.
The point we paid attention to when setting up this model is that we need to clear the outlier parts of the data set from the data set. (We saw the outlier values in the box plot).
Then let’s start building our model.
First, let’s estimate the amount of surgery that will take place the next day with the values of the last three days.
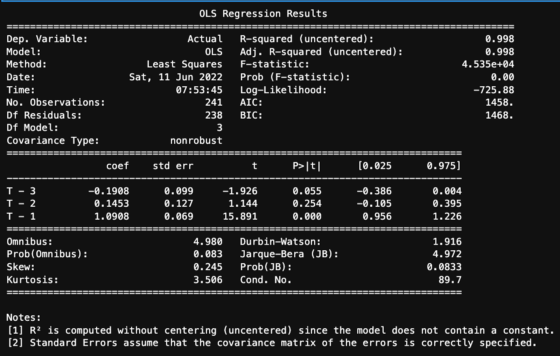
By looking at the OLS table, we can derive the equation for our regression model:
ACTUAL = (T-1)*1.0908 + (T-2)*0.1453 + (T-3)*(-0.1908) + 0*
*NOTE: Since the model does not contain a constant, we got zero std error amount.
Let’s fit our model:
Let’s also find our performance metrics RMS, RMSE, and other regression model metrics for the model we fit.
We analyzed the data of the last three days and the number of surgeries that will take place the next day. Now, let’s try to make a prediction with the data of the last 28 days, excluding the last 3 days. In other words, let’s estimate the number of surgeries that will take place 3 days in advance:

We built our model that predicts the number of surgeries performed 3 days before the surgery date and obtained performance metrics. The results don’t look bad. However, the hospital management wants to be able to estimate from earlier than 3 days. The earlier estimation will allow hospital management to give patients an earlier surgery date. It is expected that a forecast made for the last 3 days will be more successful than a forecast made for the last 7 days. However, if there is no significant difference in these estimation successes, the hospital management wishes to make an earlier estimation in exchange for waiving some success in estimation power. So, let’s set up a forecasting model 7 days ago.
We set up our model 7 days before the operation date and obtained the outputs related to our model performance. Now let’s compare the models we have established in order to make a clear decision on the most appropriate appointment date for the surgery.
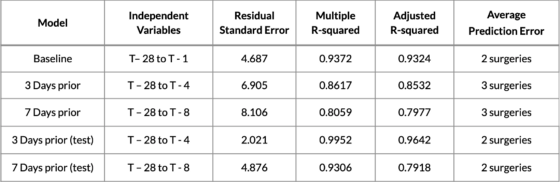
Considering this table, we can say:
- The health institution examined in the data set can accurately determine the surgery expectations 3 days before the surgery day, with the least estimation error.
- Our technical conclusion is that the last 3 days have the highest correlation with the day of the surgery. The surgery appointment can be given by looking at the situation 3 days before the surgery.
- There is no difference that can be considered vital by the hospital management between the prediction success made in the last 3 days and the prediction success made in the last 7 days. Then the hospital management can make the forecasts 7 days in advance.
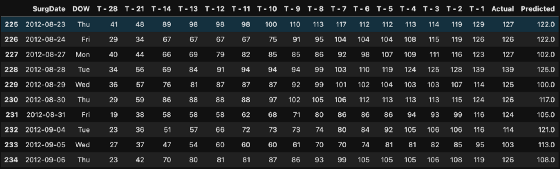
We got our result, and finally, we look at how the model we built follows a pattern in the time-series graph.

We have come to the end of our work. I hope it was an enjoyable reading session for you. See you in our next article.
References:
